Subscribe to receive top agriculture news
Be informed daily with these free e-newsletters

More U.S. farmers and even those in other countries are showing renewed interest in USDA's cover crop chart
Want to plant radishes or turnips for your next cover crop? How about cowpea or quinoa? USDA's cover crop chart, first released in 2010, is seeing increased interest with a new update as farmers battle drought conditions or prepare to protect soils over long winters with cover crops.
The cover crop chart is an online tool that helps U.S. farmers decide which crops to plant, and which crops may complement each other in a cropping arrangement.
Related: Cover crops one innovative way to cut 2016 crop costs
USDA says growers from the U.S. and 37 other countries were already using the chart before the 2015 update, which revised the chart to include 12 more crops for a total of 58 species.

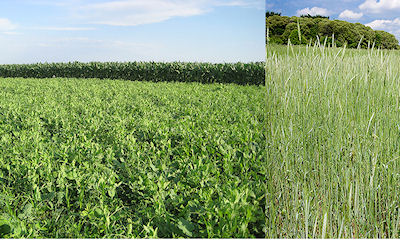
(Left) A cereal rye cover crop / (Right) A cover crop mixture that includes oat, proso millet, canola, sunflower, dry pea, soybean, and pasja turnip.(USDA photos)
The 2015 chart update also included more information on saline-tolerant grasses and placement of crop species within a cash crop rotation, USDA says.
The chart was developed by Agricultural Research Service Northern Great Plains Research Laboratory researchers in Mandan, N.D.
"Although a lot of information is available on cover crops, it is often organized by individual crops. Unfortunately, this way of looking at cover crops falls short in showing how they could potentially complement each other in mixtures," says NGPRL soil scientist Mark Liebig.
Related: Soils aren't damaged from cover crop grazing, USDA research finds
Patterned after the periodic table of elements, the interactive chart includes information on crop species that may be planted individually or in mixtures and gives specifics on growth cycle, relative water use, plant architecture, forage quality, pollination, and more, USDA says.
"In developing the chart, we realized that just as chemicals are grouped by the same electron configurations, crops could be categorized by similar attributes – cool season or warm season, grasses or broadleaf, and legumes," Liebig says.
More on USDA's chart and 8 cover crop resources >>
~~~PAGE_BREAK_HERE~~~
The chart allows growers to see the broad spectrum of potential options that may work best for them, Liebig adds. It also includes relevant research at NGPRL, particularly on forage quality, water use, and sequencing of individual crops.
"We're basically repackaging information into a useful visual aid—a first step for customers to learn about cover crops," Liebig says.
Next steps for the chart, which already can be downloaded for free online, is access to a mobile application that can be used in the field.
"We hope to be able to provide this type of access to the chart in the future," Liebig says. Read more about this project in USDA's Ag Research update.
Check out these other cover crop resources:
1. Cover Crops: Best Management Practices – A Penton Agriculture white paper
2. 10 Tips for First-Time Cover Crop Success - Farm Futures Now
3. 12 Ways to Boost Cover Crop Performance – Farm Futures Now
4. Midwest Cover Crops Council Decision Tools – Midwest Cover Crops Council
5. The Keys to Cover Crops – This Business of Farming, Farm Futures
6. Meet the 'Cover Crop Guy' - and his how-to video series – Indiana Prairie Farmer
7. Conservation Cropping System Initiative's Soil Health Practices Resource - CCSI
8. Cover Crops and Soil Health guidelines – Natural Resources Conservation Service
You May Also Like
Enter a zip code to see the weather conditions for a different location.