April 23, 2024

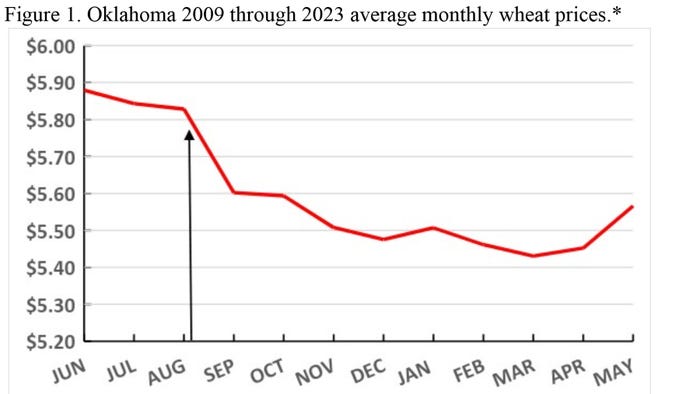
A review of historical Oklahoma and Texas wheat prices (Figure 1) shows the obvious time period to sell wheat is June through August. Using USDA’s reported average monthly 2009 through 2023 Oklahoma wheat prices (Texas Panhandle wheat prices follow the same price pattern), the average June through August price averaged 25 cents more than average September price. After September, price averages continue to decline.

Selecting the time period to sell wheat may be obvious, but the precise date to sell is less obvious.
The average 2009 through 2023 June price is $5.88, the July price is $5.87, and the average August price is $5.90. After adjusting for storage and interest costs (starting July 15), the average July price becomes $5.84 and the average August price becomes $5.83.
At first glance, it appears that it doesn’t matter which month the wheat is sold. But, over any given year, it does matter. It may also matter when you sell within each month.
Average prices and price ranges were calculated for each year, using 2009 through 2023 daily prices for June, July, and August. The average 2009 through 2023 daily June through August price was $5.83. The lowest daily price was $2.55 (August 30, 2026). The highest daily price was $11.15 (June 6, 2022).
It’s educational to note that in both 2016 (lowest price year) and 2022 (the highest price year), wheat prices were the highest in June and declined into August. In 2016, wheat prices started at $3.89, went to $4.26 (June 8) and then declined to $2.55 (Aug. 30).
In 2022 (highest price year), wheat prices started at $10.73, went to $11.11 (June 13), fell to $7.73 (Aug. 18), and finished the month at $8.73 (Aug. 31). The 2022 June through August price range was $3.38.
On June 1, 2016, the wheat price was $3.89. The last time wheat prices had been below $4 was June 30, 2010. Who would expect wheat prices to fall to $2.55 from $3.89? Wheat prices hadn’t been below $3 since April 2005. Prices can always go lower.
The average 2009 through 2023 daily June through August price (Pond Creek, Oklahoma) was $5.83. The average price range, 2009 through 2023, was $1.83. The largest price range was $3.42 (2022), and the lowest price range was $0.78 (2013).
2022 had the highest average price ($9.02) and highest price range ($3.42). The lowest average price ($3.24) in 2016 had a price range of $1.71.
Prices were slightly less volatile in years with below average prices than in years with above average prices ($1.68 versus $2.01).
So, what does the data reveal? The message is that unless you can predict prices or know someone who can, you need to stagger wheat sales during the June through August time period. Even when wheat prices are “historically” low and you believe they cannot go lower, they can and sometimes do.
About the Author(s)
You May Also Like


