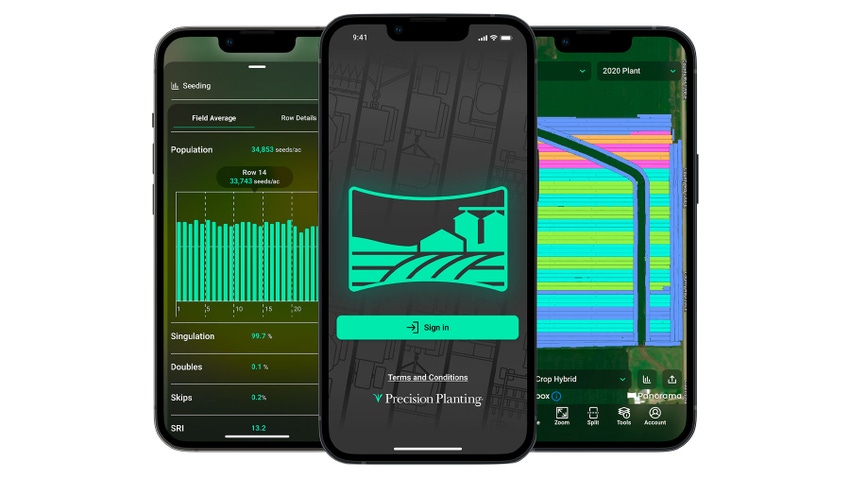
The person who invented the planter monitor likely never imagined where that technology would go. One year ago, Precision Planting announced testing of Panorama, which allows you to see planter monitor data and maps on your phone or computer. One year later, the Panorama app and website are commercially available.
Use it to see data from any Gen 3 20/20 monitor on your phone, computer or other platform of your choice. You can see not only singulation results, but also maps and other field data collected by the monitor.
Plus, the first two API connections to Panorama are now live. If you have John Deere Operations Center or Climate FieldView, link to Panorama and analyze 20/20 data. Visit precisionplanting.com.
Climate FieldView updates for 2024
Bayer spokespersons say farmers who use Climate FieldView will get more service and features in 2024, in addition to being able to link to Precision Planting’s Panorama to do more analysis with data from 20/20 monitors.
Climate FieldView now includes more robust, personalized features, with some available through a restructured premium services package. There is now a three-tier offering in the subscription package. Choose the one that best fits your needs and budget.
For example, use Field Region reports to analyze yield data by application using FieldView Plus, or search for connected partners directly within FieldView, also using FieldView Plus. Or manage variable-rate planting at scale with unlimited FieldView seed scripts using FieldView Premium. Visit climate.com.
Corn and ozone
Only someone living under a rock doesn’t know about the alarms sounded over ozone pollution. USDA researchers, working alongside researchers at the University of Illinois, recently proved something that has been suspected for years but not demonstrated conclusively: Corn handles ozone pollution better than some other crops, including soybeans and wheat.
To understand why, put on your thinking cap. Corn and sorghum are called C4 crops because carbon dioxide captured by these plants is converted into a four-carbon compound. Crops like soybeans, wheat and rice convert carbon dioxide into three-carbon compounds, making them C3 plants.
Why does that matter? C4 crop physiology generates higher rates of photosynthesis and greater efficiency of water compared to C3 plants. The researchers concluded that C3 plants have reduced chlorophyll content and seed yield when exposed to ozone compared to C4 plants. Their findings are published in Proceedings of the National Academy of Sciences.
Truth about Plant Hardiness Zone Map
Far more people than farmers rely on the USDA Plant Hardiness Zone Map. It breaks the U.S. into zones and is most often used to determine which plants are most likely to thrive at a specific location — or conversely, which plants may not survive the winter at that location.
The map was updated in 2023. There were adjustments, with some zone lines moving one way or the other. Spokespersons say that’s because temperatures vary over time. The 2023 map is based on 30-year averages of the lowest annual winter temperatures at specific locations.
Plant hardiness zones represent “the average annual extreme minimum temperature at a given location over the 30-year period.” They do not reflect the coldest it has ever been or will be there. They also aren’t direct reflections of climate change, spokespersons says.
Updates to the map are not necessarily reflective of climate change because of the highly variable nature of extreme minimum temperatures, spokespersons explain. Some updates also occurred simply because mapping methods are more sophisticated today, and data from significantly more weather stations were included.
Bottom line? Map developers caution against attributing zone changes as reliable indicators of local climate change.
About the Author(s)
You May Also Like


