Subscribe to receive top agriculture news
Be informed daily with these free e-newsletters

USDA's analysis of cash rents in 6 Northeast states shows 2016 farmland cash rents didn't 'lose much ground' despite lower grain and milk prices.
October 11, 2016
With the grain and milk price declines, you might think that 2016 cash rents in the Northeast would have dropped back from previous years. The latest data from USDA’s National Agricultural Statistics Service suggests that’s not the case.
Last week’s cash rents report compared 2014 cash rents with surveyed results for 2016. In general, more rates rose than declined. Note: Permanent pasture and irrigated cropland rents were not surveyed in most New England states. Here’s a quick state-by-state summary from that report:
Connecticut
Nonirrigated cropland in the Constitution State averaged $60 an acre in 2016, down 3% from 2014. Cash rents on irrigated land were not surveyed.

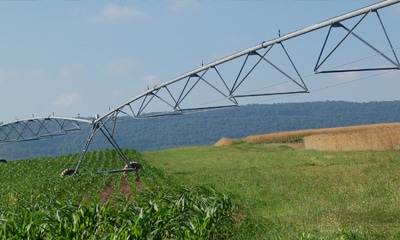
STRONGER LAND DEMAND: Irrigated cropland rental rates generally increased the most between 2014 and 2016.
Highest cash rents for nonirrigated land occurred in Hartford County, averaging $114 per acre. Lowest rates occurred in Litchfield County, averaging $29.
Delaware
Nonirrigated cropland cash rents in the First State rose 9% since 2014, to $90 per acre. Irrigated cropland increased 13% to $150 an acre in the same period.
The highest nonirrigated average rate was $94 an acre in New Castle County. The lowest nonirrigated county average was $88.50 in Sussex County.
Irrigated land in Kent County averaged a $155-per-acre cash rent. The lowest average rent was New Castle County’s $130.
Maine
Cash rents in the Pine Tree State were assessed only for nonirrigated land and averaged $53.50, up 11% from 2014. Aroostock County had the highest average in 2016, at $73.50 an acre. Waldo County had the lowest average, $21 an acre.
Maryland
NASS tallied Free State cash rents on permanent pasture, plus irrigated and nonirrigated cropland. Pasture rents averaged $45 an acre, up 3% from 2014 and the highest pasture rent in the Northeast. Rates were highest in Cecil County — $114 an acre — and lowest in the state’s western region, $25.50.
Nonirrigated cropland averaged $100 an acre statewide, up 9% from 2014 and highest in the Northeast. Carroll County cropland commanded the highest cash rent average, $136 an acre. Western Maryland’s Allegany County had the lowest nonirrigated cash rent, $23.50.
Statewide, irrigated cropland values rose 22% from 2014 to 2016, averaging $175 an acre. Highest and lowest rent values were not calculated by county.
Massachusetts
In the Bay State, nonirrigated cropland rental values dropped 14% from 2014 levels to a $53-per-acre statewide average. Franklin County cash rents topped the state this year at $84.50. Worcester County’s average was the lowest — $26 an acre.
Irrigated cropland cash rents were a different story with the state average of $212 an acre, up 12%. Franklin County topped the state and the Northeast at $395 an acre. The lowest rate was again in Worcester County, at $103.
New Hampshire
Nonirrigated cropland cash rents increased 21% over the two-year period in the Granite State, reaching $41 an acre. The highest average was in Grafton County, $43 an acre; the lowest wasn’t recorded.
New Jersey
Permanent pasture rental rates in the Garden State averaged $40 an acre in 2016. The 2014 average was not reported.
Rent on nonirrigated cropland rose 5% between 2014 and 2016, to $60 an acre. Warren County had the highest 2016 average, $76.50. New Jersey’s northern district had the lowest, $35.50.
Statewide, irrigated cropland rental rates rose 12% over the two years, reaching $112 an acre. The highest average rate came in the southern district, $132. The lowest average was $72 in Burlington County.
New York
Permanent pasture cash rates in the Empire State topped all states with a 25% increase from 2014 to 2016. While the $25-per-acre rate remained well under the values reported for other Northeast states, Wyoming County’s $82-per-acre rate topped all Northeast counties. New York’s lowest average was Delaware County’s $11 an acre.
2016 nonirrigated cropland cash rents were up 7%, averaging $58 an acre statewide. The Long Island district topped the state with a $123 average. Greene County posted the lowest rent average — $23.50 an acre.
New York’s irrigated cropland posted the Northeast’s only rental rate decline, but only a 6% drop from 2014. Again, the Long Island district topped the state with a $273 average rate for 2016. The central district had the lowest average — $70.50 per acre.
Pennsylvania
Permanent pasture rates in the Keystone State rose 11% over the two-year-period to $30 an acre. Chester County’s average topped the state at $82 an acre. Greene County’s $8.90 was the lowest reported rate for the Northeast.
Nonirrigated cropland rent was unchanged, holding at $78 an acre. The state’s highest 2016 average rate was Lancaster County’s $224 an acre. The lowest was $14.50 in Green County, again the lowest value reported in the Northeast.
Pennsylvania’s irrigated cropland average rose 19% to $155 an acre. But the highest 2016 rate didn’t occur in Lancaster County. Blair County’s average topped the state at $165 an acre. The lowest 2014 rate occurred in the northeastern district — $42.50.
Vermont
2016 permanent pasture rents in the Green Mountain State decreased 5% from 2014 levels, to $20.50 an acre. Franklin County’s $39 average was the high. Caledonia County’s $9.40 average was the low.
Vermont’s nonirrigated cropland rent average remained at $48 an acre. Orange County had the state’s highest 2016 rate — $73.50. Windsor County came in with the lowest rate, at $25 an acre.
You May Also Like
Enter a zip code to see the weather conditions for a different location.


