With grain prices consolidating in a sideways trade pattern for nearly two months, the market has been patiently waiting for fresh fundamental supply or demand news. No question that the 2020/21 fundamentals are bullish, with ending stocks so tight. This is why corn and soybean futures prices have been overall supported at these higher values.
Next week’s Quarterly Stocks and Prospective Plantings report will shed light on both old crop supplies on hand, and the potential for new crop supplies for the 2021/22 crop year. Trade will eagerly await the data as more planted acres are needed to ease old crop tight ending stocks.
The price reaction after next Wednesday’s report is expected to be volatile due to the bullish tone of the market.
From a technical standpoint the longer a market trades in a sideways fashion, the bigger the price breakout may become. Quite frankly, depending on results of the report next week, soybeans are in a technical trading pattern where the breakout move will likely be $1.50 (higher or lower depending on USDA data). Corn prices look subject to a potential 50 cent move (higher or lower depending on USDA data).
Are you ready for that?
Soybean scenarios
Still the bullish fundamental leader in this marketplace, soybeans almost feel as though they don a bullet proof vest heading into this report, the fundamentals are that bullish. That being said, here are points to consider.
First thing to watch on Wednesday’s report is the Quarterly Stocks data. Trade analysts have been insisting for two months that the carryout is even tighter than what USDA is suggesting, and that price rationing has not yet begun for remaining soybean supplies in this country. If the Quarterly stocks data is friendly, and shows current supplies on hand may be tighter than anticipated, that will be a bullish factor to lift prices higher in and of itself.
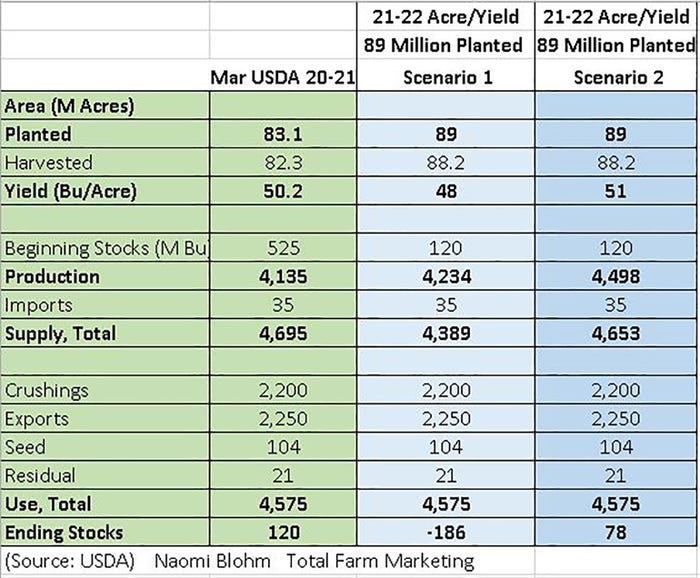
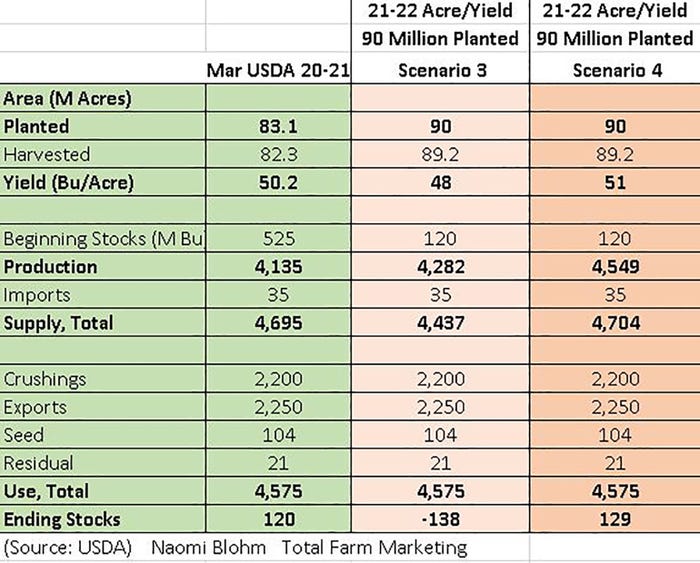
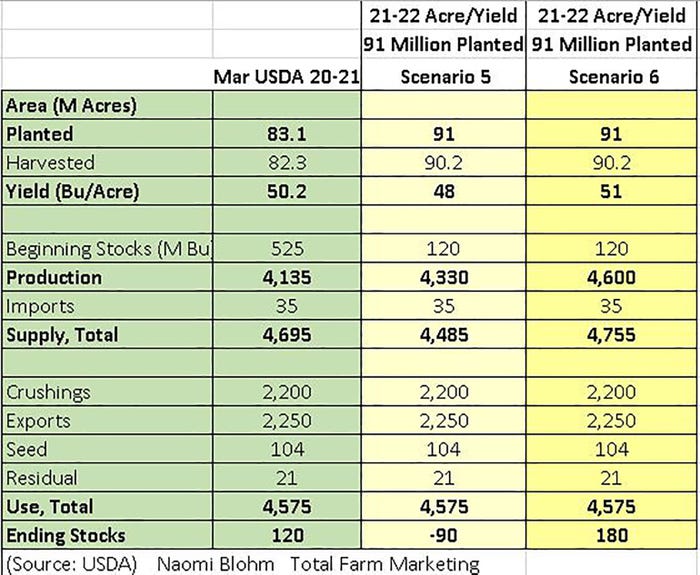
Next, turn your eyeballs to the planted acres number. The USDA Outlook forum in February pegged planted soybean acres at 90 million acres. In the images that follow, I show how ending stocks differentiate between different acre and yield scenarios for the 2021/22 growing season.
Bottom line, soybeans need all the acres they can get and then some.
First understand that in the scenarios below, I used demand tables from the March 9 WASDE report.
If the quarterly stocks report suggests that ending stocks are even tighter than what was printed on the March 9 WASDE report, that only makes the soybean story that much more bullish.
Read those two sentences again; this is critical.
Heading into this report, trade assumes that soybean planted acres will be near 90 million acres, as was suggested on the February Outlook Forum data. But what if it’s less? If planted acres come in at 89 million acres, and there is no changed to demand from the March 9 WASDE report, with trendline yield of 51 bushels per acre, then ending stocks are 78 million bushels. That is MUCH less than the current USDA number of 120 million bushel carryout for the 2020/21 season.
If the USDA reports that 90 million acres of soybeans will be planted in this country this spring, and makes no changes to the demand aspect, then with trendline yield of 51 bushels per acre endings stocks improve to 129 million bushels (up from 120 mil bu. now). If 90 million acres of soybeans are planted, with no changes to demand or old crop ending stocks, but yield is slightly less, then ending stocks DROP to a negative value.
In the third scenario, even if the USDA predicts 91 million acres of soybeans to be planted this spring, with trendline yield of 51 bushels per acre, ending stocks increase to 180 million bushels, which is still supportive for prices.
At this point, it would take a black swan of demand destruction to take the friendly fundamental aspect away from soybeans. Clearly, weather this spring and summer will be critical for soybean prices.
In my examples, I’m using conservative yield numbers, and not even accounting for potential drought.
Corn has more wild cards
Switching over to corn, there is a much broader scope to consider for Wednesday’s report. First, do draw your eyes to the Quarterly stocks data. There is much discrepancy for how much corn is actually remaining in the countryside.
Lower yields last fall, attractive prices, strong exports, and farmers owning more bins, makes it a bit trickier to know for sure where current supplies on hand actually are. Trade needs to get a handle on that data, and then will quickly shift attention to the planted acres information.
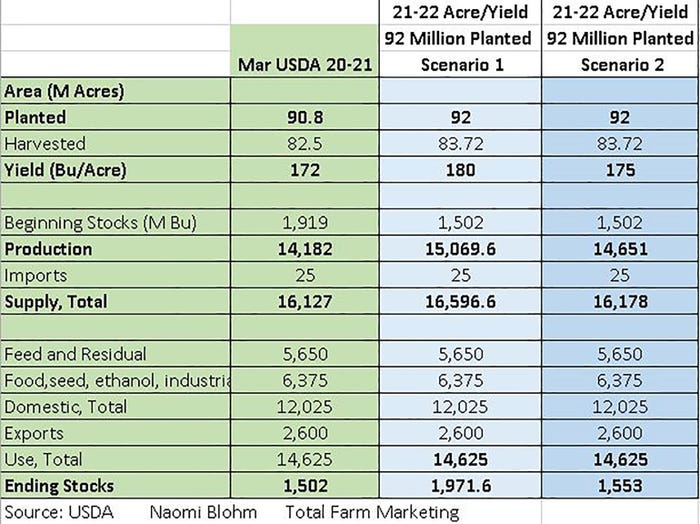
In the charts that follow, there are three important things to understand. Like soybeans, regarding demand numbers, I used demand information from the March 9 WASDE report. Next, I used a 91% planted-to-harvested ratio. (Traditionally, the planted-to-harvested percent ratio is always somewhere between 91% and 92%. I chose 91% as that matched more closely with the March 9 WASDE data.)
Last, I used 180 bu. per acre as my trendline yield number and 175 bpa as my “lower” yield number. These yield estimates pretty much assume great weather this growing season. This does not assume drought or other weather/production issues. (Compare to the yield for the 2020/21 season of 172 bpa and the yield from the 2019/20 season which was 167.5 bpa.)
In February’s Outlook Forum USDA suggested planted acres for corn this spring would likely be near 92 million planted acres. If true, and using trendline yield of 180 bpa, then ending stocks increase from 1.502 billion bushels, to 1.971 billion bushels. If 92 million acres are planted, but yield is 175, then there are barely any changes to ending stocks from the 2020/21 season to the 2021/22 season.
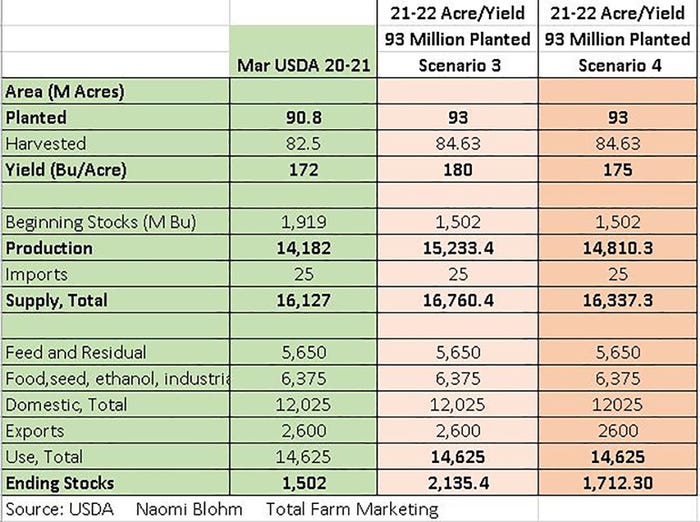
Current pre-report estimates anticipate more than 92 million acres of corn to be planted, however. Here is what the demand table looks like if there are 93 million acres planted. If yield is 180 bpa, then ending stocks grow substantially to 2.135 billion bushels. However, 93 million acres planted with 175 bpa for yield only allows for small growth of ending stocks, up to 1.712 billion bushels.
Here is the Debbie Downer
Should the USDA forecast planted acres closer to 94 million acres, and make no changes to demand from a Quarterly Stocks aspect, then the corn market will likely react negatively. Trendline yield on 94 million acres points to nearly 2.3 billion bushels of corn. And even with a slight weather hiccup and 175 yield on 94 million acres pegs ending stocks at 1.871 billion bushels.
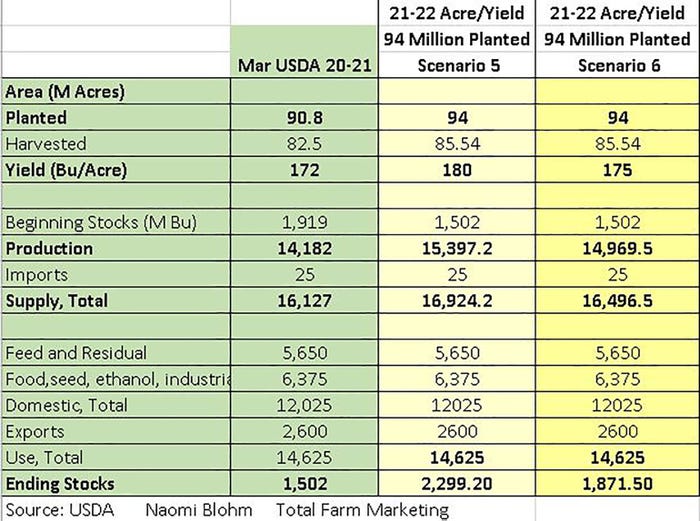
Remember – going forward, USDA (on paper) for the 2021/22 crop year will use a trendline yield until weather proves otherwise – and sometimes “weather proving otherwise” doesn’t show up on USDA reports until June.
What’s at stake
There is a lot a stake on this upcoming report. Yes, soybean fundamentals are quite friendly, but you can see how if the USDA predicts anything more than 93 million acres for planted corn acres (without a draw down in stocks), it may take summer weather before corn prices can move higher.
March 31 is also end of quarter. April 1 begins a new quarter, with potential for “fund money” to impact price movement depending on USDA data released on March 31.
Being ready for this type of price reaction and volatility takes time on your part to prepare your marketing strategy for any of the scenarios above. This is a market where you need to manage upside price potential, but also manage price risk. Managing both aspects ahead of the report is what makes you a good marketer. Solely reacting after the report is done will likely allow for emotion and regret. Are you ready?
Reach Naomi Blohm: 800-334-9779 Twitter: @naomiblohm and [email protected]
Disclaimer: The data contained herein is believed to be drawn from reliable sources but cannot be guaranteed. Individuals acting on this information are responsible for their own actions. Commodity trading may not be suitable for all recipients of this report. Futures and options trading involve significant risk of loss and may not be suitable for everyone. Therefore, carefully consider whether such trading is suitable for you in light of your financial condition. No representation is being made that scenario planning, strategy or discipline will guarantee success or profits. Any decisions you may make to buy, sell or hold a futures or options position on such research are entirely your own and not in any way deemed to be endorsed by or attributed to Total Farm Marketing. Total Farm Marketing and TFM refer to Stewart-Peterson Group Inc., Stewart-Peterson Inc., and SP Risk Services LLC. Stewart-Peterson Group Inc. is registered with the Commodity Futures Trading Commission (CFTC) as an introducing broker and is a member of National Futures Association. SP Risk Services, LLC is an insurance agency and an equal opportunity provider. Stewart-Peterson Inc. is a publishing company. A customer may have relationships with all three companies. SP Risk Services LLC and Stewart-Peterson Inc. are wholly owned by Stewart-Peterson Group Inc. unless otherwise noted, services referenced are services of Stewart-Peterson Group Inc. Presented for solicitation
The opinions of the author are not necessarily those of Farm Futures or Farm Progress.
About the Author(s)
You May Also Like


