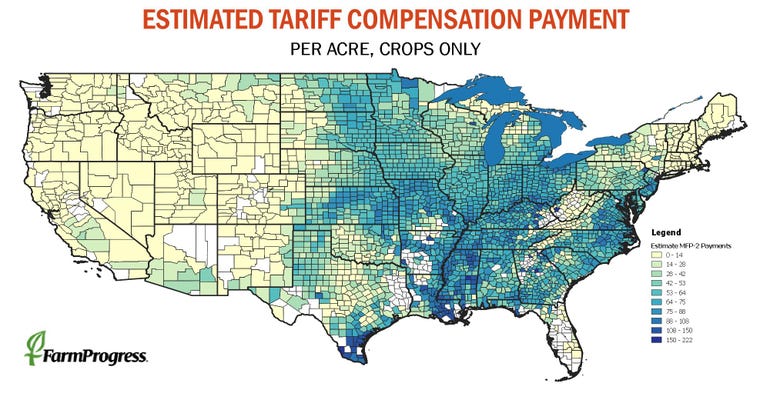
Want to know how big your next round of tariff compensation might be? Just look at your neighbors.
The first Market Facilitation Program payments came on each farm’s production of covered crops, made on a per bushel basis. MFP-II will allocate funds on a per acre basis, based on the total loss suffered by each county as a whole from an expanded list of crops.
USDA presented only the bare outline of the plan last week, and its methodology for allocating aid may not be known for a month or more. Payments won’t begin until farmers certify acreage to the Farm Service Agency by July 15, and processing the claims could take several additional weeks or more.
But if the agency uses a scheme similar to the mechanism from MFP-I, it appears the average county payment for crops could run around $47 an acre nationwide. Payments will also be made to cover losses from hogs and dairy, and some fruit and nuts in three installments. Farm Futures analysis, based on FSA certifications and other USDA estimates for 2018, shows payments could vary widely from county to county. The key determinant is whether farmers in the county allocate a higher percent of their farms to crops that suffered the greatest loss in export sales in the wake of trade disputes.
In the first round of payments, soybeans were by far the loss leader, after China slapped 25% retaliatory tariffs on imports from the U.S. Payments to soybean producers accounted for nearly 76% of the $9.6 billion distributed. Livestock received around 9% of the payments, while cotton (6%), corn (2%) sorghum (3%) and wheat (3%) were all covered.
To figure how payments might change for the second round, we looked at the latest export data to figures losses. The expanded list of crops included in the aid shifted some of the money around as well. Soybeans, for example, accounted for 74% of the lost export market this time. Sorghum’s share could more than double to nearly 8%, while cotton (5%) and corn (1%) both slipped, with wheat about the same. Newcomers to the program, including alfalfa hay, barley, dried peas and beans, chickpeas, lentils, flaxseed, oats, peanuts, rapeseed, rice, sunflowers, sesame and crambe, account for the rest.
Our analysis assumed farmers plant these crops in the same proportions as last year, which may or may not happen. If it does, counties that tend to favor soybean, cotton, sorghum and wheat over corn, oats and barley will receive larger per acre payments. Some in the South could top $80 an acre, while corn-hungry states in the west and upper Midwest could drop below $25. Most counties in states like Illinois and Iowa with well-established rotations could see payments around the national average. Farmers will be paid on the total of the covered crops they certify, subject to a $125,000 limit.
While our estimates are just a guess at this point, they at least provide a starting point for growers weighing alternatives as the deadlines imposed by both man and nature arrive. Final planting date for full crop insurances coverage on corn is May 31 in Iowa and much of Wisconsin and Minnesota, with most of the eastern Corn Belt following June 5. Yield potential for corn and soybeans is also falling.
Growers mulling prevent planting on corn know what their coverage will provide: in most cases, their APH times 55% times the projected spring price of $4. But even this relative certainty may be in play.
A provision put into the disaster bill passed by the Senate last week expanded the $3 billion in ag aid to farmers unable to plant crops due to floods. In addition to basing payments on the higher of the spring price or the harvest price for crop insurance, the bill doesn’t specify whether it extends only to farmers in counties with declared disasters. Just who gets what and where is up to the discretion of the Ag Secretary, and Senate sources note that aid in the past to farmers was nationwide.
Even without any additional payment, Farm Futures analysis showed that prevent plant on corn would at least cover cash costs in 85% of corn counties.
The interactive map below shows our estimate of the MFP-II aid per acre for counties nationwide. Click on the blue flag to see the figures for a county, zooming in or out with the wheel on your mouse.

About the Author(s)
You May Also Like


