Subscribe to receive top agriculture news
Be informed daily with these free e-newsletters

For cow/calf operations matching nutritional environment and cow type is necessary if low cost beef production is the goal.
March 30, 2010
By David L. Lalman
Recent information published by Cattle-Fax indicates that a typical cow/calf enterprise has been profitable only nine of the past sixteen years. Sixty to seventy% of beef cow enterprise costs are attributed to feed and grazing costs. Consequently, matching nutritional environment and cow type is necessary if low cost beef production is the goal. Many traits must be considered in a multiple trait selection program with the goal of designing cattle that excel within their given environment. Genetic potential for growth, dam’s milk production and available nutrients (environment) are the major factors that determine calf weaning weight. Due to the adoption of expected progeny differences (EPD’s), making genetic changes in growth and milk production has become a relatively simple task. The purpose of this paper is to explore the influence of genetic change for various traits on nutrient requirements of beef cows and the practical implications associated with those changes.
Factors influencing maintenance energy requirements
Maintenance is the condition when a non-productive animal neither gains nor looses body energy reserves. Maintenance energy requirement, then, is the amount of energy required to maintain a cow’s body weight when she is neither gestating nor lactating and when she is experiencing no weather stress.
Energy needed to maintain the breeding herd represents the single largest energy cost in the total beef production system. Approximately 70% of the feed energy required for beef production is used by the cowherd and greater than 70% of the energy required by the cowherd is associated with maintenance (Ferrell and Jenkins, 1984). Consequently, nearly 50% of the total feed energy required for beef production is associated with energy costs for cow maintenance. In light of this information, it is obvious that the study of maintenance energy requirements holds great potential to improve cow/calf enterprise profitability as well as to improve total beef production efficiency.
Breed
Breeds of cattle have been shown to differ in maintenance requirements. In general, there is a positive relationship between maintenance requirement and genetic potential for measures of productivity (such as growth rate and milk production; Ferrell and Jenkins, 1985; Montano-Bermudez et. al., 1990). Much of this increase in energy expenditure is due to larger organ mass relative to body weight (Ferrell and Jenkins, 1985). Organ weights generally are greater in breeds of cattle with high milk production. Organs that have high metabolic activity, such as heart, liver and the digestive tract, have tremendously high energy expenditure. For the first time in 1996, the National Research Council Subcommittee on Beef Cattle Nutrition has suggested that maintenance energy requirements be adjusted based on breed (NRC, 1996). The Angus breed is used as a base; other breeds are adjusted up or down within a range from -10 to +20%. These adjustments apply to both growing and mature animals. Table 1 shows NRC’s suggested adjustment for maintenance energy requirements as well as suggested values for breed average birth weight and peak milk production. Because little is known about the influence of crossbreeding on maintenance energy requirements, no heterosis is assumed. Energy requirement adjustments for crossbred animals are assumed to be a simple weighted average based on breed composition.
Table 1. Maintenance requirement adjustment, calf birth weight and peak milk production for selected beef breedsa
Breed | Maintenance requirement Adjustment |
Birth weight, lb. | Peak milk yield, lb./day |
Angus | 1.00 | 68 | 18 |
Braford | .95 | 79 | 15 |
Brahman | .90 | 68 | 18 |
Brangus | .95 | 73 | 18 |
|
|
|
|
Braunvieh | 1.20 | 86 | 27 |
Charolais | 1.00 | 86 | 20 |
Gelbvieh | 1.10 | 86 | 25 |
Hereford | 1.00 | 79 | 15 |
|
|
|
|
Limousin | 1.00 | 82 | 20 |
Santa Gertrudis | .90 | 73 | 18 |
Shorthorn | 1.00 | 82 | 19 |
Simmental | 1.20 | 86 | 27 |
aFrom NRC, 1996
Within breed differences
Di Costanzo et al. (1990) reported that the average maintenance requirements of Angus cows was 156.7 kcal metabolizable energy (ME) per kilogram of body weight.75 with standard deviation of 18.4. In other words, 95% of the data would have fallen within the range of 119.9 to 193.5 kcal ME / kg WT.75 (the mean plus or minus two standard deviations). If this variability represents genetic and not experimental variation, this wide range in maintenance energy requirements actually is good news because considerable variation is needed to make significant genetic progress through selection for any given trait. The bad news is that no simple method is available to determine maintenance requirements of individual cattle in order to enhance selection for this trait. Producers who select for females with moderate to high milk, yet maintain fleshing ability, relative to other animals in their herd, may be selecting cattle with lower maintenance requirements. However, the “easier fleshing” cows might simply be consuming more digestible energy than “harder keeping” cows.
Milking ability
As mentioned above, maintenance energy requirements tend to increase as level of milk production increases. In a Nebraska study (Montano-Bermudez et al., 1990), cows of similar mature size but differing in milk production were used to compare maintenance energy requirements. Hereford X Angus cows represented the lower milk production group while Milking Shorthorn X Angus cows represented the higher milk production group (Table 2). Even though differences in milk production were moderate (18.7 versus 23.2 lb. per day), maintenance requirements for “high” milk cows were 9% higher during late gestation and 10% higher during early lactation compared to “low” milk cows. However, no direct relationship between milk production and maintenance requirements has been established within a breed.
Table 2. Maintenance energy requirements of crossbred beef cows differing in genetic potential for milka
Item | Low Milk | High Milk |
Milk Production, lbs. per dayb | 18.7c | 23.2d |
Adjusted body weight, lbs. | 1140c | 1102d |
Late gestation maint. Req., Kcal ME / kg WT.75 / d |
108.5c |
118.5d |
Early lactation maint. Req., Kcal ME / kg WT.75 / d |
130.5c |
143.5d |
aAdapted from Montano-Bermudez et al., 1990. J. Anim. Sci. 68:2279.
bAverage of measurements taken 46, 67 and 95 d post-calving.
c,dMeans in the same row with different superscripts differ (P < .05).
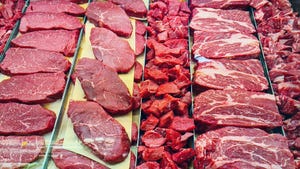
Body composition Body composition varies tremendously both among and within breeds of cattle (Coleman et al., 1993; Marshall, 1994). Furthermore, the average composition of fed cattle has changed significantly over the past twenty years according to National Beef Quality Audit data (Table 3). The industry has selected for larger, leaner animals and implemented more aggressive management systems in an effort to increase beef production efficiency and improve carcass cutability. Changes in composition of our nation’s beef cowherd likely is less dramatic than those for fed cattle, due to the use of terminal sire mating systems and changes in finishing phase management that do not affect the cowherd. Nevertheless, these changes in fed cattle carcass composition probably reflect an evolution to leaner type beef cows. Table 3. Carcass specifications for fed cattle, 1974 – 1995a Item USDA, 1974 NBQA, 1991 NBQA, 1995 Carcass weight, lbs. 678.7 759.9 747.9 Fat thickness, inches .62 .59 .47 Ribeye area, square inches 11.8 12.9 12.8 Ribeye area per 100 lb. carcass wt., square inches 1.74 1.70 1.71 USDA yield grade 3.40 3.16 2.82 U.S. Prime and Choice 75% 55% 48% Yield grades 1 & 2 30% 44% 58%
aNational Beef Quality Audit, 1995.
Unfortunately, lean tissue mass has a staggering impact on maintenance energy requirements. Di Costanzo et al. (1990) estimated energy required for protein tissue maintenance to be 192.9 kcal ME/kg compared to 20.7 kcal ME/kg for fat tissue. Based on these estimates, a 10% increase in protein content of an 1100 lb beef cow results in a 7% increase in total energy required for maintenance (Table 4). Another concern associated with selecting leaner females in the Northern United States is that more energy is required to maintain thermo neutral conditions during winter. Leaner animals have less subcutaneous fat; fat serves as insulation against the cold. Together, these factors raise red flags as the beef industry focuses on halting its loss in market share. Certainly, waste fat must be minimized in beef production systems to improve product quality and reduce post-weaning inefficiencies. However, cattle breeders must keep in mind that selection for heavier muscled, leaner type beef cows will increase nutrient requirements. Terminal sire mating systems that maximize progeny carcass merit while maintaining moderate cows with low feed requirements is a logical method to overcome this antagonism (Bennett and Williams, 1994).
Table 4. Maintenance energy requirements for 1100 lb. beef cows with moderate or high protein composition
| Average protein compositiona | High protein compositionb |
Empty body protein % Lbs. |
16.74 157.5 |
18.43 173.4 |
Empty body fat % Lbs. |
18.84 177.26 |
14.59 137.28 |
Energy required for maintenance, Mcal ME / dc Protein tissue Fat tissue Total |
13.74 1.66 15.4 |
15.19 1.29 16.48 |
aComposition calculated for 1100 lb. live weight cow with body condition score 5 (NRC, 1996).
bTen% greater protein composition compared to cow with average protein composition.
cCalculated using data of Di Costanzo et al., 1990. J. Anim. Sci. 68:2156.
Matching mature size and milk production to feed resources
Optimum cow size has been one of the most hotly debated topics in the beef industry for many years. Mature size is an important trait because of its influence on nutritional requirements, calf weaning weight and ultimately, carcass size. Early growth traits are correlated positively with mature size. In other words, when selection is based on growth rate alone, mature size will increase. Larger cows have greater nutrient requirements simply because they have more biologically active tissue to maintain. However, greater nutrient requirements do not always mean lower cow efficiency. For example, a large factory may have greater fixed and variable costs compared to a small factory but cost per unit of product often favors the larger factory, because fixed costs are spread over more units of production. In areas of abundant, high quality forage, low cost feed grains and protein sources, the increased value of production per cow may offset the increased feed inputs. Table 5 shows the energy needed for maintenance, gestation (fetal development) and lactation of two cows differing in mature size with the same genetic potential for milk production.
Table 5. Comparison of energy required for 1100 and 1400 lb. beef cowsa.
Item | Moderate | Large | Difference, % |
Mature weight, lb. | 1100 | 1400 | 27 |
Energy required for one year, expressed as megacalories of net energy |
| ||
Maintenanceb | 3317 | 3976 | 20 |
Gestation | 356 | 450 | 26 |
Lactation | 899 | 899 | 0 |
Total | 4572 | 5325 | 16 |
aAssumes calf birth weight is 6.8% of cow weight and peak milk production is 18 lb. per day.
bMaintenance energy requirements = .077 Mcal NEm / kg empty shrunk weight.
Even though the 1400 lb. cow is 27% heavier than the 1100 lb. cow, she requires 20% greater energy for maintenance and 16% greater total energy. However, one key implication is that fewer 1400 lb. cows can be stocked on a given unit of land due to the greater total energy requirement. If stocking density is not reduced for the larger cows, greater supplementation will be required to maintain moderate body condition and thus, reproductive success. Consequently, larger cows are better suited to operations with abundant, high quality forage and/or low cost supplemental nutrient sources.
Milk production
Milk production is an important trait because of its dramatic influence on feed requirements and calf weight at weaning. Milk production has increased substantially in beef cattle over the past 15 years (Figure 1). According to information from national cattle evaluations, milk production in most breeds of cattle continues to climb steadily.

Like increased mature size, increased milk production does not come without a cost. Milk is a nutrient dense product, with about 25% protein and 130% total digestible nutrients. Table 6 shows the energy required for maintenance, gestation and lactation for 1100 lb beef cows differing in milk production. Because of milk’s high protein content, protein requirements increase by .03 lb per pound of additional milk produced.
Table 6. Comparison of energy required for cows varying in milk production
| Peak milk yield, lb/day |
Item | 12 |
| Energy required for one year, expressed as megacalories of net energy |
Maintenancea | 3317 |
Gestation | 356 |
Lactation | 600 |
Total | 4273 |
|
|
| % of Total |
Maintenance | 77.6 |
Gestation | 8.4 |
Lactation | 14.0 |
aAssumes maintenance requirement is constant at .077 Mcal NEm / kg shrunk body weight.
Even though cows with peak milk production of 24 lb. produce twice as much milk compared to cows with 12 lb. peak milk, energy requirements are only 14% greater. This is a result of less total energy being used for maintenance and a greater%age of energy being directed to milk production. Note that maintenance requirements were assumed to remain constant, which is likely not the case. The bottom line is that total nutrient requirements are greater with higher milk production. In an Oklahoma study (Buchanan et al., 1996), crossbred cows were mated to Hereford and Angus bulls that differed widely in milk expected progeny difference (EPD). Cows from both high and low milk EPD sires were managed together, so that both groups receive similar supplementation. During the first two years of this trial, Angus sired cows from bulls with high milk EPD’s have had lower body condition scores at weaning compared to Angus sired cows from bulls with low milk EPD’s (Table 7). Cows from Hereford sires did not differ significantly. Increasing milk production beyond moderate levels may add to enterprise risk due to year to year variation in forage availability, quality and supplement costs.
Table 7. Calf weaning weight and cow body condition score from cows sired by high and low milk EPD bullsa.
Breed | Hereford | Angus |
Milk EPD group | Low | High |
Milk EPD | -10.5 | 16.8 |
205 d weaning weight, Lbs.b |
422 |
450 |
Cow body condition score |
5.10 |
4.98 |
aFrom Buchanan et al., 1996. Okla. Agr. Exp. Sta. Res. Rep. P-951:1.
bAverage of steers and heifers.
c,dMeans with different superscripts differ (P < .01).
Putting it all together
In order to evaluate the economics of changing various traits, producers must have some guideline to estimate associated changes in production. Table 7 was developed to estimate milk production in beef cows. However, it can also be used to estimate calf weaning weight and as such, is a useful tool to evaluate cow size and milk production for a given operation.
Table 8. Relationship of mature cow weight, peak milk production and calf weaning weighta
| Peak Milk lb/day |
Mature weight, lb. | 6 |
| Average expected 7 month steer calf weight, lb. |
1030 | 431 |
1100 | 449 |
1170 | 464 |
1250 | 477 |
1320 | 491 |
1400 | 504 |
1470 | 517 |
aAdapted from Fox et al., 1988. J. Anim. Sci. 66:1475.
Whether added weaning weight comes from milk production or increased mature size, the relationship between calf weight and sale price is usually negative. This negative relationship is magnified if milk production is sufficient to allow calves to become over-conditioned at weaning. Historical market prices for fleshy claves, as compared to moderate and thin calves sends a strong signal that over-conditioned calves do not perform as well during the growing phase. Usually, when grain prices are high, value of additional weaning weight is high. Conversely, when grain prices are low, value of additional weaning weight gain is low. Typically, this value ranges from $.45 to $.65 per pound of additional weight, but occasionally varies beyond this range. Another important factor influencing value of gain is seasonal price patterns. Typically, calf prices are higher in spring and lower in the fall. Consequently, value of added gain generally is higher for fall born calves. Of course, the higher cost of maintaining lactating cows through the winter months may offset this advantage.
Larger, heavier milking cows require more forage and so do their calves (Table 9). Calves from cows with greater milk production consume less forage compared to calves from cows with lower milk production. These factors have implications on herd size, stocking rate and profitability, and should be considered when designing the “optimum cow” for a given operation.
Table 9. Influence of cow size and milk production on calf value, herd size and calf income.
Cow Weight | 1100 | 1400 |
Peak Milk, lb./d | 12 | 18 |
Calf Weighta | 491 | 526 |
Price / CWTb | $92.00 | $89.54 |
$ / Calf | $451.72 | $470.97 |
$ / Cow Exposedc | $379.44 | $395.61 |
|
|
|
Lb. Forage DM Required / Cow |
7,533 |
8,061 |
Lb. Forage DM Required / Calfd |
1,288 |
1,137 |
Total Forage DM | 8,821 | 9,198 |
Herd Size per 374 Acrese |
104 |
100 |
Calf Income per 374 Acres |
$39,462 |
$39,561 |
Acres Required per 100 Cowse |
359 |
374 |
aFrom Table 7.
bValue of added gain is $.55 / Lb.
cPregnancy rate is 89% and weaning rate is 84% (Northcutt, 1995).
dFrom Fox, 1988.
eDry matter production per acre is 3500 lb. Grazed forage utilization rate is 65% and hay storage/feeding loss is 20%.
This example may partially explain why cow size and milk production has increased significantly over the past 20 years. Increased weaning weight and the subsequent increased return per cow is relatively easy to document. However, gradual changes in supplement amount, hay purchased, herd size, stocking rate or fertilizer inputs are much more difficult to document without detailed production and financial records.
Because of the increased forage intake by the cow and the calf (lower stocking rate), and the decreased value per pound of calf weaned, large cows in this example produce less total income when land area is held constant. As mentioned above, if stocking rate is not reduced, either more expensive purchased or harvested feeds must be provided, or reproduction will suffer dramatically. The end result is even lower returns than projected. As in the previous examples, these calculations do not consider the possible increase in maintenance requirements associated with increased milk production.
What about the incentive for purebred producers to select for added weight gain through increased milk and/or increased mature size? If commercial cattlemen do not understand the potential economic consequences of increasing either trait beyond moderate levels, they can provide a strong incentive for purebred breeders to select for extreme cattle. The incentive is in the form of sales and sale prices, favoring bulls with heavier weaning weights, frame size and/or yearling weights. With today’s large breed association data bases, producers now can select for cattle with rapid growth within mature size limitations. This often has been referred to as “bending the growth curve”. This selection technique continues to have tremendous potential in improving beef production efficiency.
Finally, commercial cattlemen should strive to buy cattle from breeders with a similar environment and similar management to their own. Cattle that are raised in an “artificial” environment, with exceptionally high feed inputs, may not function well in a commercial setting where low cost production is the goal.
Considerations for retained ownership and beef alliances
If calves are to be retained through a grazing and/or feeding period, post-weaning growth potential and carcass merit become important factors. Little is known regarding the influence of added weight due to increased dam milk production. Some information from Australia indicates there is a negative relationship between dam’s milk production and calf post-weaning gain. This would be expected if calves were fleshy at weaning due to high milk production in the dams. A study at OSU currently is evaluating this relationship. Logically, changes in genetic potential for milk production will need to be matched with genetic potential for growth to avoid inefficiencies.
More cow/calf producers are becoming concerned with end product characteristics because of increased involvement in alliances and retained ownership. Carcass weight specifications for value based marketing systems will have a greater influence on cow size in the future. Dr. Ron Bolze (1994) makes an excellent observation regarding mature cow size:
“As the industry continually responds to emerging concepts of Value Based Marketing in an attempt to produce more uniformity, consistency and consumer acceptability in endproduct specifications, another thought process may have merit. With the exception of the Southern climates requiring at least some Brahman derivative influence and the desert regions demanding extremely low maintenance cattle, the majority of the remaining continental United States could justify essentially the same type of genotype with merely adjustments in stocking rate to account for differences in feedstuff availability. Reducing genetic variation in this manner would have immeasurable positive impact on industry wide attempts to produce greater uniformity, consistency and consumer acceptability of beef.”
Mature cow weight at body condition score 5 is a good indication of the feedlot finish weight (at low choice quality grade) of her male progeny. Assuming a carcass weight target window between 650 and 800 lb., mature cow weight would need to be limited to roughly 1100 to 1300 lb (Fox et al., 1988). In terminal sire mating systems, smaller cows can be mated with larger bulls to produce desired carcass weight and minimize cow maintenance requirements.
Summary
Maintenance energy requirements make up over 50% of feed energy needed to produce beef. Practical measurements to identify cattle with low maintenance requirements need to be developed in order to enhance selection for this trait. As the beef industry has implemented genetic and management changes to improve production efficiency and product quality, overhead costs associated with cow maintenance likely have increased as well. The optimum cow, in terms of size and milk production, depends on many factors; forage production and supplement costs are major considerations. Increased calf weaning weight provides a clear view of genetic and management change. The increased cost associated with larger, leaner type beef cows and/or excessive milk production is real, although difficult to measure. As the industry evolves into more shared risk/reward relationships across segments, the incentive to increase beef cow mature size, muscling and milk production beyond moderate levels will be dramatically reduced.
Lalman is an Extension Beef Cattle Specialist at Oklahoma State University.
You May Also Like
Enter a zip code to see the weather conditions for a different location.